I get this question a lot: “If you were going to design your first trading model in Excel, what system would you start with?”
The answer has a lot to do with what you trade and what you consider “trading”.
Are you a stock trader or a foreign currency trader? Do you take long term positions in ETFs to get broad-based exposure to major market trends and money flows? Or do you swing trade futures on an intraday basis? Do you trade long, short or both?
Your approach to developing a trading model in Excel will differ depending on your answer.
Let’s Break It Down
It’s helpful to narrow things down a bit by asking a more useful question:
“What is common among nearly all trading strategies, regardless of the security traded or the time frames used?”
The answer?
Capturing big directional price moves. Big directional price moves are the Golden Egg.
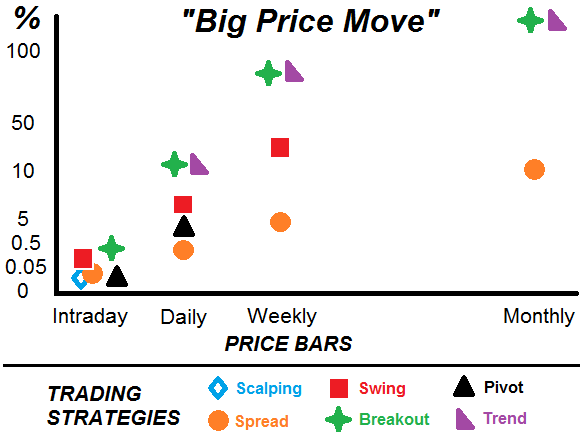
Excel Trading System Strategies & Time Frames
What is a Big Price Directional Price Move?
By “big directional price move” I mean “bigger than the average price move for the security, using a particular trading strategy, in a particular time frame (intraday, daily, weekly)”.
Security + Trading Strategy + Time Frame
A 5 minute S&P 500 e-mini future trend scalp may appear miniscule to a weekly ETF trader. Likewise a long term CANSLIM stock trader’s “big directional price move” would seem enormous for a FX swing trader using daily price bars.
As you can see from these two S&P 500 charts from StockCharts.com the concept of a “big price move” is significantly different between daily and weekly time frames.
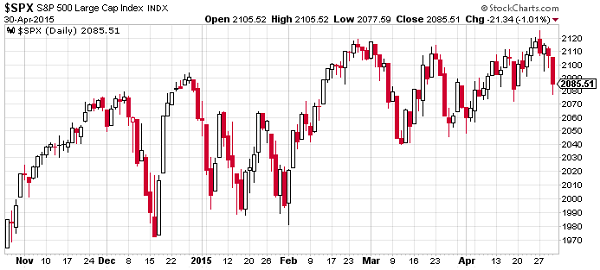
S&P 500 Daily Time Frame
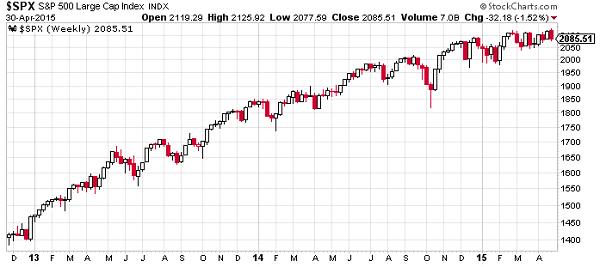
S&P 500 Weekly Time Frame
Regardless of the time frame your first Excel trading model should focus on capturing a few large price movements. Larger price moves have more “bang for the buck”, fewer trades required, less work and lower operational risk (Internet or data outages, for example).
There are two types of big directional price moves: 1) a continuous price move and 2) a price gap. Price gaps are highly unpredictable, so we’ll assume most traders are targeting big directional price changes that persist over time and have open and close price continuity.
So what does this have to do with designing Excel trading models?
The Excel trading system you design has to match your trading instrument, the time period you trade in, and the data available to populate the trading spreadsheet.
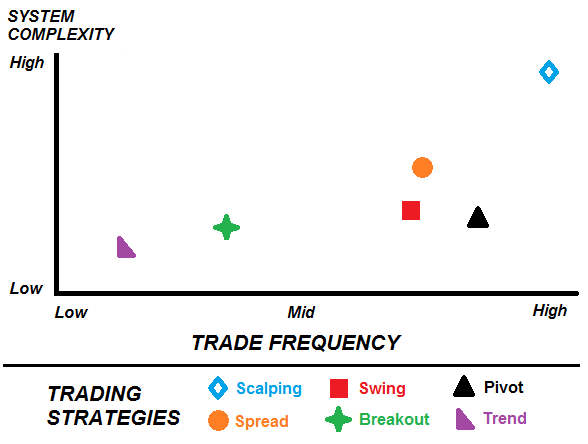
Excel Trading System Complexity vs. Trading Strategy
Your Excel model functionality must also match the trading style you use. If you’re a long term trader who relies on weekly charts and fundamental data, a simple manually operated formula-based Excel trading model can do the trick. If you’re scalping 1 minute bars, then you need to feed your Excel model with real time prices, run the logic in VBA code and potentially automate trade execution by integrating with your broker’s API.
Recommendations for Your First Excel Trading System
Your first Excel trading model should focus on capturing larger price moves. This typically means a trend trading, breakout, swing trading, market cycle or technical-fundamental “fusion” system.
Your first trading model should not be too complex. Starting with longer time frames allows you to focus on your trading strategy, rather than the technicalities of VBA coding, price feeds and automated trade execution.
Here are several universal trading strategies for your first Excel trading model project. These strategies can generate substantial profits and get you started quickly without unnecessary technicalities (CLICK THE LINKS TO LEARN MORE)
- Trend Trading Model
- Breakout Trading Model
- Swing Trading Model
- Correlation Trading Model
- Pivot Trading Model
- Sector Rotation Model
- CANSLIM Model
- Turtle Trading Model
I will discuss these strategies in future posts. In the meantime, happy trading!


