Build an Automated Trading System in Excel Course
This course teaches everything you need to build a profitable automated end-of-day trading model in Excel for stocks, ETFs and forex!

What You Get

How To Course
Step-by-step course covers strategy, data, formulas, VBA and FAQs

Price Data Import
Detailed instructions on importing price data into Excel

Back Test Model
Includes a complete back testing model with detailed stats

Watch List
Watch and generate trade signals for 100+ securities
Detailed Overview
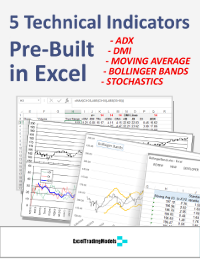
The model includes 5 proven technical indicators (ADX, moving average crossovers, stochastics, Bollinger bands and DMI). You are guided in a detailed fashion through creating worksheets, files, ranges, indicator formulas, control buttons, DDE/Active-X links and code modules.
The model incorporates both trend-trading and swing-trading features. The swing-trading feature can be turned on or off, depending on your trading style.
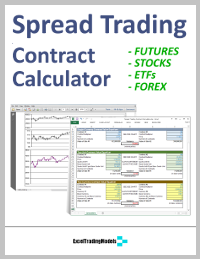
The system can be used to generate trading signals for 100+ stocks, currencies or ETFs.
If you already have our Trend Trading Model in Excel, this course will show you how to automated your model to handle 100+ securities at a time.
After building the model, you simply import the end of day price data, run the model with the click of a button, make your trading decisions, and enter your trade orders with your broker.
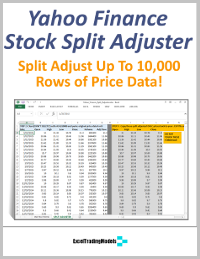
The course shows you how to import prices automatically into your Excel model from free downloaded .csv files or from DownloaderXL.
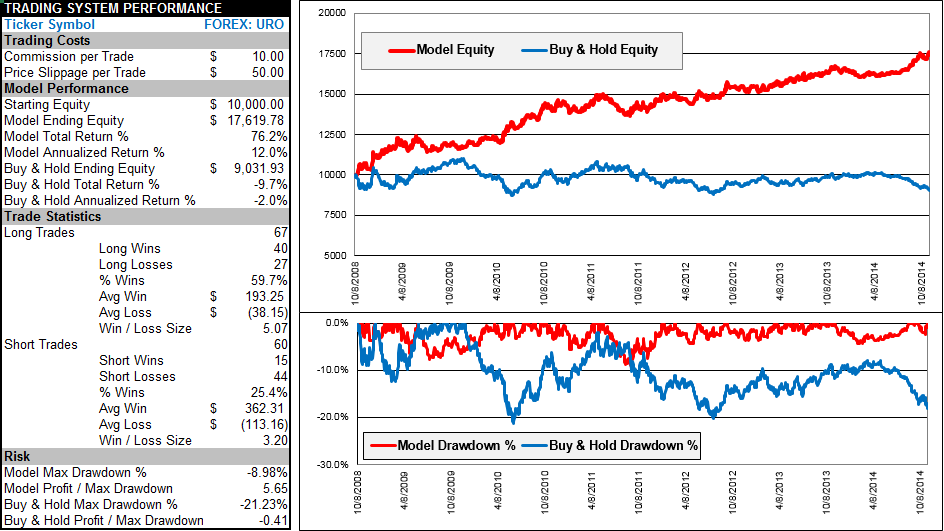
A pre-built back testing model is included that allows you to test the system versus buy-and-hold over 5 years of price history. The back test model displays detailed performance and risk statistics to help you select a watch list with a greater probability of generating large profits.
IMPORTANT NOTES:
1) The Excel model you build in this course will automatically import prices using free .csv price files you download from the Internet. It can also be connected to an external paid data provider or broker with a DDE / Active-X link for Excel. The course assumes you can access the data necessary to run the model.
2) The Excel model in this course does not send trade orders and confirmations directly to and from your broker’s system. It creates buy-sell orders in Excel, which you review and submit to your broker manually. You can extend the model yourself to integrate it directly with your broker’s order execution system using your broker’s Excel API. Interactive Brokers, E*TRADE, Merrill Edge and others offer Excel API integration. Implementing an Excel API connection to a broker is not covered in this course.
Sample Performance
Model results are in red vs. buy & hold in blue
Screenshots
Calculations Worksheet

Watch List and Trading Signals

Back Testing Model

Strategy Guide

Benefits
Learn how to integrate Excel, VBA, formulas and data sources into a profitable trading system |
|
Calculate buy/sell signals on a watch list of up to 100 stocks, ETFs or currencies in seconds |
|
Save significant money by eliminating recurring data and software costs |
|
Get instant access to the course materials in a zip file emailed directly to you |
|
Apply the knowledge you gain to any Excel modeling or analysis project |