This is where the rubber hits the road — implementing your trading model strategy logic with Excel formulas.
Excel gives you a rich formula language to create and measure relationships between data inputs and generate new data outputs. In our case, the data outputs are trading signals, shares, profits and losses, etc.
There are four major categories of Excel formulas you will use:
- Comparison formulas, including if-then, greater than, equal to, less than, equals, not equals, etc.
- Mathematical and statistical formulas, using Excel’s built in functions or math/stats add-ins.
- Data population formulas, such as sums, averages, bins, standard deviations, etc.
- Text output formulas, such as “BUY”, “SELL” and “NEW TRADE”
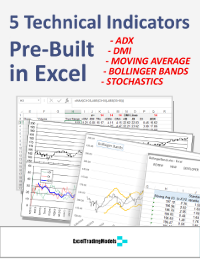
A major source of formulas in your Excel trading model will likely be technical indicators. You can create your indicators in Excel with formulas or you can use a technical indicator add-in kit such as TraderXL Pro that calculates them for you.
Either way, you will need to link the results of these formulas together with more formulas. It’s this formula linking capability that lets you gradually build a full-fledged trading model in Excel.
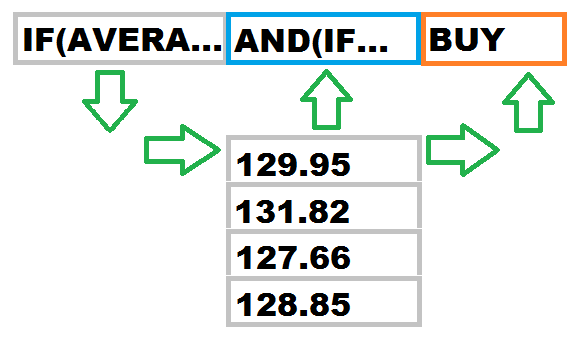
Your formula building sequence should mimic how you want the model to work.
First, capture input data, including prices, economic data, position data, etc.
Second, calculate your metrics or indicators. These can be common technical indicators such as moving averages, RSI, or Bollinger Bands, or statistical indicators such as R-squared, regression, correlation, etc.
Third, compare the indicator outputs to determine if they meet your trading signal conditions.
Fourth, generate trading signals.
Fifth, scale your trades by your position sizing rules, if applicable.
Sixth, publish the trading signals and position sizes to a trading dashboard for manual execution, or to your broker for automatic execution.
Seventh, monitor your profit and loss figures and feed them back to the model, and incorporate into new trading signals, if applicable.
Repeat the above as time progresses.
You will need to test all of your formulas for errors and omissions before executing actual trades. This requires you to create test cases with expected inputs and outputs. Test cases can be simple, such as a missing data field, or elaborate, such as a strings of inputs and formula results over time.
Now that you have your trading model formulas implemented and tested, you are ready for Step 5 >