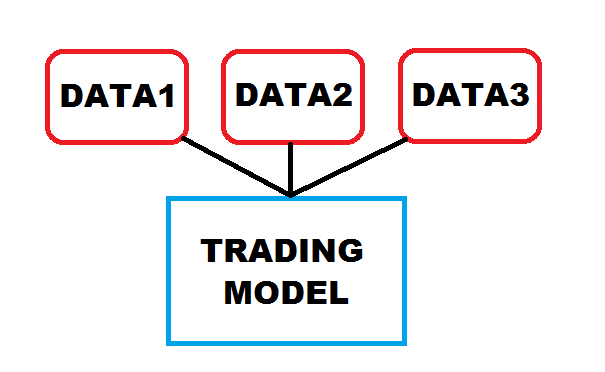
 Now that you have the workbook, worksheets and formulas set up, the next step is to add “fuel” to your Excel trading model by importing market data.
Market data can include prices, spreads, volume, yield curves, volatilities, economic indicators such as PPI or GDP, weather data, Twitter data, sentiment data, etc.
How you import your data into Excel will depend on the type, frequency and source of the data. Most trading models consume asset prices, yields or rates as a measure of the market’s value. Some trading models use transaction volume, open interest or market depth as a measure of liquidity and money flow. Others use econometric inputs such as prepayment curves, employment numbers, etc. Still others use inputs from a variety of data services, such as cycle data, broker sentiment data, analyst cumulative buy or sell recommendations, etc.
Intraday market data is best fed into Excel via a DDE/Active-X link directly from the broker through whom you will execute trades. Alternately, a data aggregator such as Bloomberg, Reuters, IDC, etc. can be used to import data into Excel.
End of day price or rate data can be downloaded to Excel from a variety of sources, including Yahoo Finance (stocks, ETFs, funds, indices, dividends, options), Google Finance (stocks, ETFs), PiFin (FX, futures, indices), CBOE (options) and the standard institutional sources Bloomberg, Reuters, IDC, etc. This can be via DDE/Active-X link, web query, or file import using XML, CSV, TXT, etc. Import into Excel can be manual or automated.
Economic data is available from a variety of sources, including those above. Governments (e.g. U.S. Federal Reserve, Bank of England) and industry associations (e.g. BBA) provide regular data through their websites for download. The frequency and formats can vary widely, so there is normally some manual steps required.
How you set up your Excel workbook and any integrated databases will contribute to the efficiency of your data input process.
You should automate this process as much as possible. However, it’s important to include a data check step to verify the data quality before executing trading signals from your Excel model. The most common problem with model failures is poor quality data, so don’t forget to check before you trade!
Now that your model has its fuel, it’s time to move on to Step 6 >