Once you have your trading strategy rules written down, the next step is to design your Excel trading model layout.
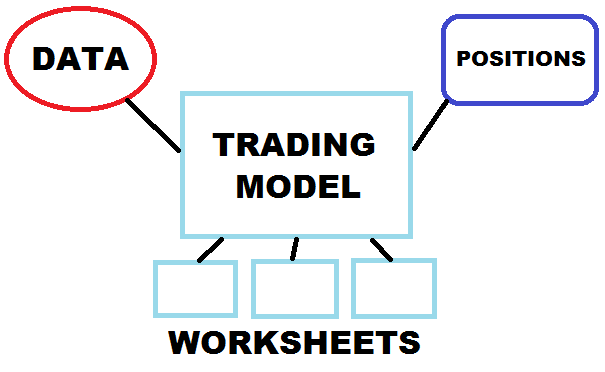 Excel gives you four components to work with: Workbooks, Worksheets, Code Modules and Add-Ins.
You can also integrate other components into your automated trading system, including DDE/Active-X links, charting or formatting widgets, your broker’s trading API, market data sources such as Bloomberg or Yahoo Finance, economic data sources such as IDC or Reuters, position databases, and other inputs.
At a basic level, the three main components you need to consider are:
- Excel workbooks, for example the trading model workbook and a market data workbook
- Excel worksheets, for example a Controls worksheet, technical indicators worksheet, data worksheet, trading signals worksheet, position blotter worksheet, charts worksheet, etc.
- Market data source, generally Open-High-Low-Close-Volume prices, and perhaps other inputs like volatility, economic or sentiment data.
There is no “right” layout that works for every trading model or user preference, so feel free to experiment with your Excel model layout.
Single asset trading models often have simple layouts. Models that scan a large number of assets and track a variety of portfolio metrics and data input sources can be much more complex.
Don’t worry if your initial layout design needs to be modified. Expect your Excel trading model to evolve over time as you optimize it for the best experience.
Now that you have an initial trading model layout, you can move on to Step 4 >


