One of the big questions when developing a breakout trading system is “how do you define a ‘breakout’?” Defining a breakout usually comes down to four criteria:
- What is the look-back period?
- What high (or low) price do you use to define the breakout level?
- How far does price need to break out above (below) the breakout level to qualify as a “break”?
- How much time (or how many bars) does price need to stay above (below) the breakout level?
The shorter the look-back period, the higher number of breakout trades your system will generate. The look-back period should be long enough that random price movements aren’t mistaken for breakouts. It should also be short enough to generate an adequate number of profitable trades.
You can choose the highest high (or lowest low) price, or the closing price, or some average of prices, as your breakout threshold.
The distance traveled above (or below) the breakout level is also important. Intraday traders focused on a small number of securities often use ticks or price increments. Watch list and swing traders often use percentage moves, standard deviations or average true ranges (ATRs).
How long a breakout actually holds (e.g. how much time or how many price bars) may also be important in the profitability of your breakout trading system. That is the question we will explore in this article.
1-Day vs. 2-Day Breakouts
Let’s trade daily bars for this exercise. I want to know, all else being the same, which of these two conditions is likely to generate higher returns with lower risk in my breakout trading model:
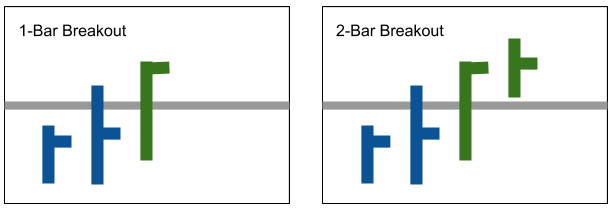
Condition 1: Long breakout occurs when a single bar closes above the breakout price threshold
Condition 2: Long breakout occurs when a single bar closes above the breakout price threshold AND the immediately following bar also closes above the same price threshold.
In effect, I’m asking “is it more profitable with less risk to require a second bar breakout for confirmation, or is a single close breakout adequate?” Intuitively, I know that a double breakout bar pattern will generate fewer trades. The question is whether the quality of trades will increase, such that my return vs. risk gets better than the single-bar model.
To ensure I didn’t accidentally pick a high or low spot in the P&L curve, I compared the two conditions by the percentage return both after 5 days and after 20 days. I hoped this will tell me whether a longer or shorter holding period was better. This revealed some very interesting behavior as you will see below.
Backtesting Breakouts With Multiple Securities
To get a reasonable answer, I broke out (no pun intended) my trusty Excel software and build a back testing model with price data and formulas. This is not a full P&L model because I’m just looking for simple price returns from a theoretical trading pattern. I don’t need to cumulate returns over time or include transaction costs. That can come later if I find a good pattern to trade.
When you back test a general question like 1-day vs. 2-day breakouts, it’s best to start with a range of different securities. I already found a few instruments that traded well with a breakout model in my prior article here. We will use the same securities: Taser stock (TASR), Repligen stock (RGEN), Zynga stock (ZNGA), iShares Silver ETF (SLV) and ICE Coffee (KC). As you can see below, each of these securities had a distinct price trajectory over the roughly 7-year test history. A bigger breadth of securities would produce a more statistically significant test, but I only had the time for a limited exploration.
The value of backtesting multiple securities is the avoidance of curve-fitting. If my breakout model is going to be truly useful, then I should be able to trade many different securities with it, and not have to make significant alterations. I’m looking for stable performance across securities, NOT spectacular performance in only a few, which tends to lead to curve-fitting and unstable future performance.
Breakout Performance: TASR Stock
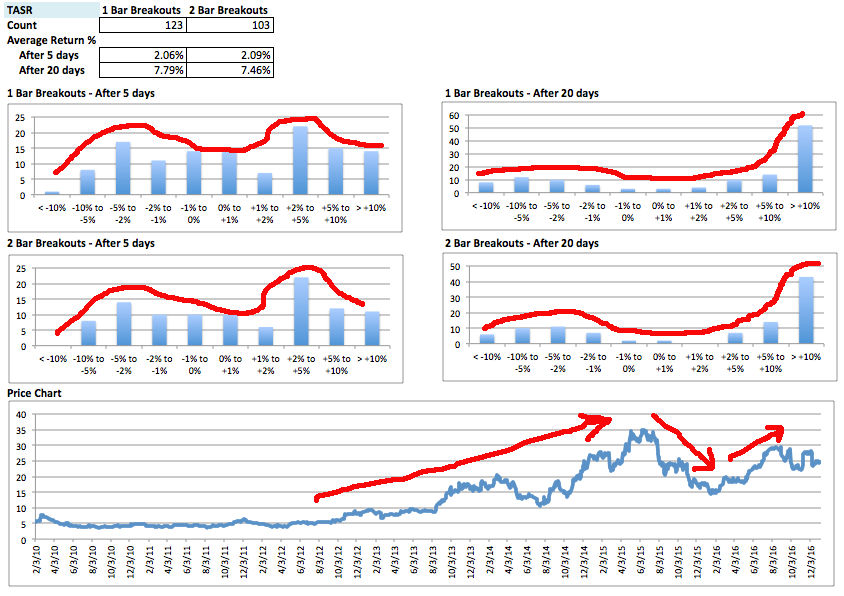
TASR stock produced 123 1-bar breakouts and 103 2-bar breakouts. Average returns of both 1- and 2-bar breakouts were similar after 5 days and 20 days holding periods. The return histograms were both skewed to the positive (right). TASR price went from around $5 to $35 per share in the back test period, so this is natural. A distinctive “barbell” pattern appears in the 5-day holding period histograms. The return peaks are both around the 2-5% mark, both positive and negative. The most striking thing is the number of trades that exceeded +10% returns after 20 days — 3X more than any other return bucket. This shows that when a security is strongly trending longer holding periods generate substantially greater returns, as long as you’re on the right side of the trend!
Breakout Performance: RGEN Stock
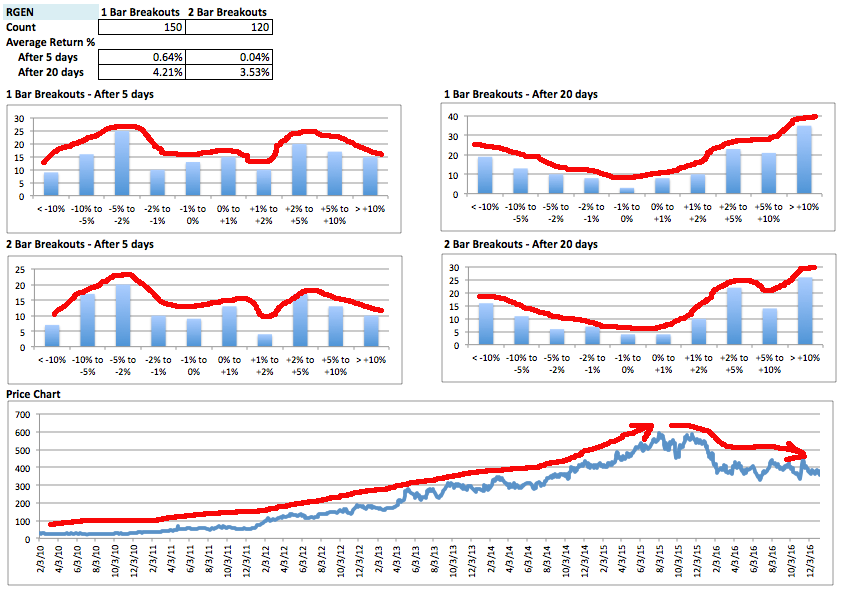
RGEN had a similar performance pattern to TASR, supported by a multi-year price trend up from around $20 to $600 per share. There were 150 1-bar breakouts and 120 2-bar breakouts. Average returns were similar for both breakout patterns after 5- and 20-day holding periods. Similar to TASR above, the 20-day holding period produced big returns skewed to the right (wins). But the distribution was more even, with more losing trades. Interestingly, the same distinctive “barbell” pattern appears in the 5-day holding period histograms. The return peaks are both around the 2-5% mark, both positive and negative.
Breakout Performance: ZNGA Stock
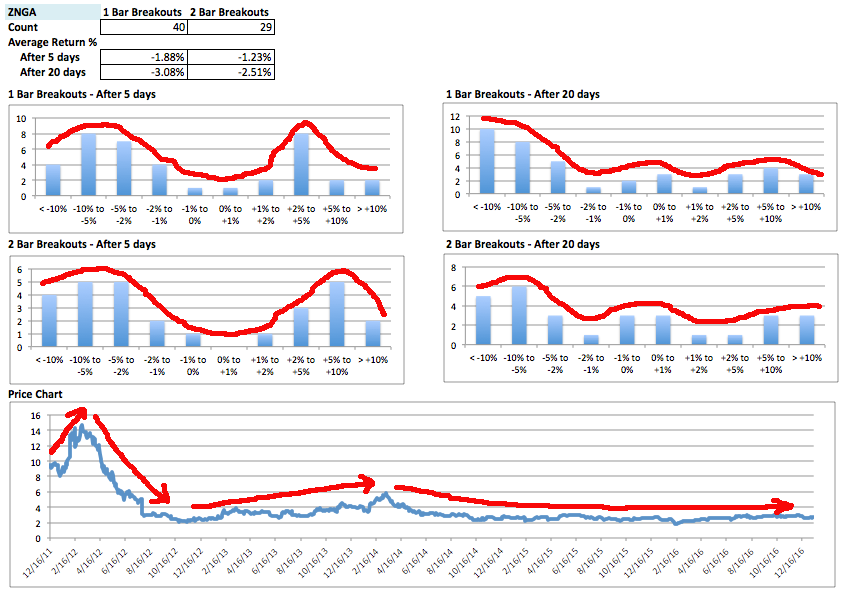
ZNGA had the exact opposite price trend than TASR and RGEN — this stock was a dog, losing roughly 80% of its value during the test period. Naturally, long breakout trade returns were substantially skewed to the left (losses) after a 20-day holding period. Again, the same “barbell” pattern appears in the 5-day holding period histograms. The return peaks around the 2-5% mark on winning trades and -2% to -10% on losing trades.
Breakout Performance: iShares Silver ETF (SLV)
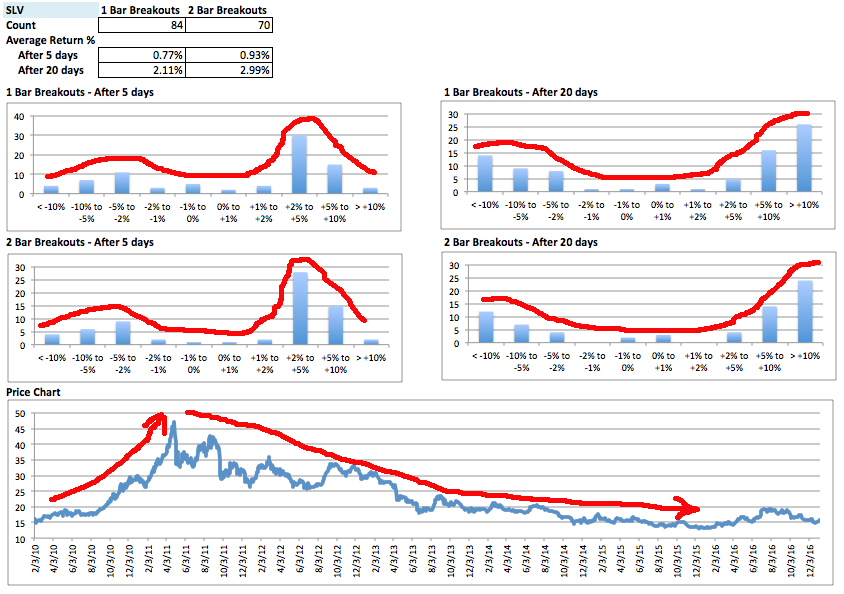
SLV took off to the upside in the commodity boom of 2011, then slowly dropped back to its original level in a volatile manner over the following years. The breakout model caught many large positive trades with 20-day holding periods, and many 2-5% positive return trades with 5-day holding periods. The “barbell” shape again appears on the 5-day histograms, clustered around 2-10% returns. The number of trades was much fewer over the same time period than the other securities, which suggests SLV is not as breakout-prone with short look-back periods.
Breakout Performance: ICE Coffee (KC)
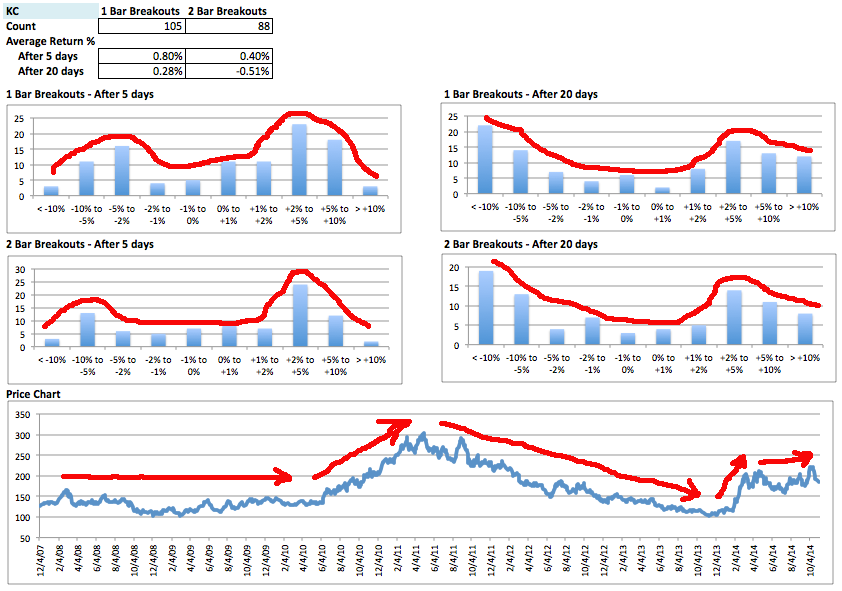
Our final candidate, ICE Coffee Futures (KC) had a complex price pattern, starting with a flat period, rising to double price, followed by a long fad down to its starting point, and moving into another volatile up move. The familiar “barbell” pattern appears with nearly the same price clustering as the other securities for 5-day holding trades. The 20-day holding trades performed unpredictably, with large numbers of big losing trades, and large numbers of big winning trades. During this period you would want to be very careful holding breakout trades for long periods.
Breakout Performance: ALL Securities Combined
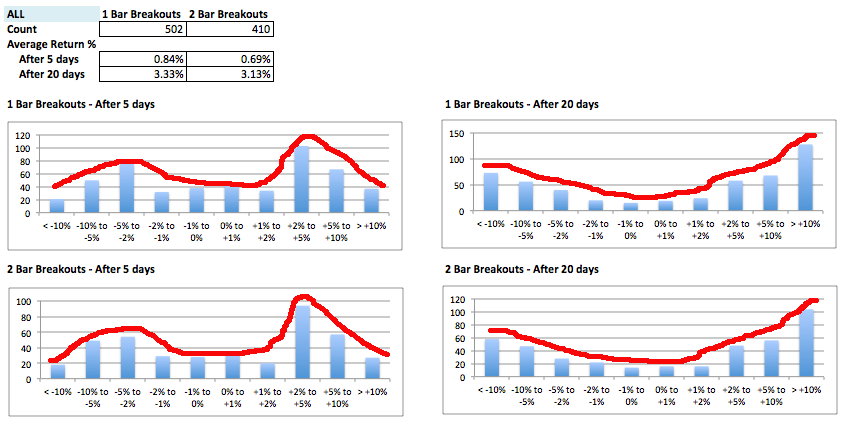
The patterns identified above become very clear when you combine all back tests into one. Here we compare 502 1-bar breakout trades and 410 2-bar breakout trades. The 20-day holding period shows a minor skew to the right (wins), with a large number of trades with > 10% returns. The 5-day holding period shows the same distinct “barbell” pattern with clustering around the 2-5% return points, both positive and negative. You can see the histograms are much smoother when they incorporate hundreds of trades. This means the return distribution is more predictable, and it’s why you should trade multiple securities with your models whenever possible.
What Have We Learned?
First, we can expect about 20% fewer trades with 2-bar breakouts while overall the returns do not drop nearly as much. This suggests that the 2-bar breakout pattern is superior from a reward-to-risk standpoint. With fewer trades, the 2-bar breakout pattern would offer less time in the market, lower commissions and greater returns from invested cash.
Second, expected returns from a 20-day holding period are much greater overall than the expected returns from a 5-day holding period. This makes sense, as we are really trying to capture the mega-moves with a breakout model. These big moves offset the many small losses from false breakouts.
Finally, given the large number of big winning AND losing trades with a 20-day holding period after a breakout, it may make sense to use a stop-loss as protection from adverse moves. If a breakout reverses and goes against you, the last thing you want to do is hold on and see what happens. Good breakout traders take a small loss (if price hasn’t gapped and it’s still possible to get out) and move on to the next breakout trade. Setting a 8% or 10% stop-loss would eliminate most of the big negative returns on the left side of the histograms above, resulting in much greater overall returns with less risk.
I hope you get some value from these experiments. When in doubt, test your assumptions and you might find some interesting (and trade-able) patterns!
Learn More
To get started with breakout trading using Excel check out this Breakout Trading Model >


