Breakout trading strategies are some of the best systems for generating significant capital gains. However, breakout systems pose a particular challenge that can chew up your account equity quickly:
Is this price move really a breakout?
If you can’t answer this question with some confidence, then you don’t know a) IF you should take the “breakout” trade, b) WHEN you should take the trade, and c) HOW MUCH to risk on the trade. You’re just trading blind.
This is a conundrum that must be solved.
I use a very dependable (and simple) Excel breakout trading model. To feel more comfortable allocating capital to this model, I’ve done some exploration over the years to identify whether the markets I’m trading are actually breakout-friendly.
(FYI – I use multiple trading systems for diversification to smooth out my equity curve. If I don’t feel I have a grip on the inputs and probabilities of each model, I am less likely to allocate capital to that model. If I understand the probabilities and things line up then I tend to allocate more capital to the strategy.)
How to tell if your market is “breakout friendly”
To me, a security is “breakout friendly” if it has regularly shown “legs” in past breakouts — in other words it has a propensity to keep going once it breaks out of a price range. That’s the type of security you want to trade with a breakout system.
Here is an example of Taser (TASR) stock showing multiple breakouts above the 52 day high on the upside and one on the downside with significant follow-through.
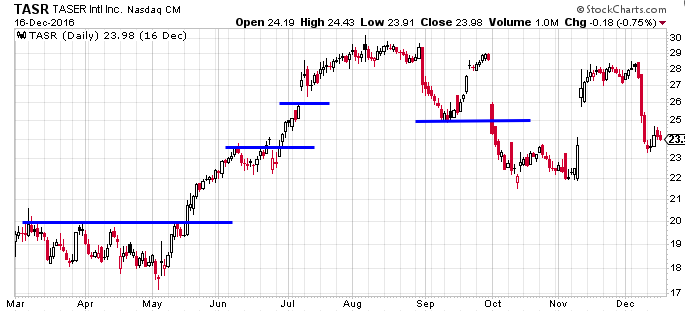
Conversely, if a security has a strong history of “peeking and hiding” again in the prior range (or worse, reverses into a Bull Trap or Bear Trap), then it’s not right for a breakout system.
Below you can see an example of the FTSE EuroTop 100 Index with a clear horizontal price channel. In this 6 month period there were two false breakouts and a major real breakout.
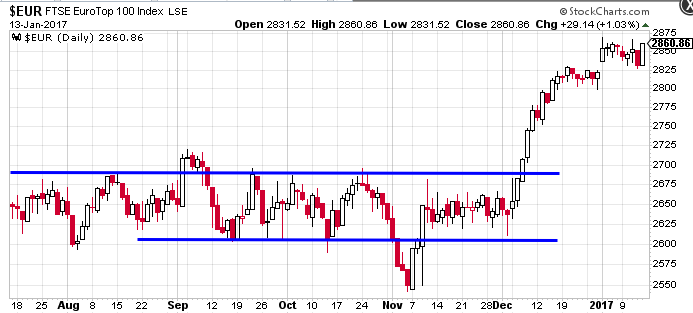
(Charts courtesy of StockCharts.com)
These examples are very situational, of course. To have confidence that a security is “breakout friendly” we need to do a long-term analysis so there are enough data points to provide a statistically significant answer.
My simple test for breakout friendliness
First, define a “breakout” as 2 consecutive closes above/below the high/low of a predetermined look back period. When working in daily time frames I use 10 days (minor breakouts) or 52 days (major breakouts). Feel free to define your own look back period.
Second, price cannot retrace below/above the close of the first breakout bar within the next 5 days. This means price has held significantly above/below the breakout level, which suggests a material change in market sentiment. This tends to attract more money which can drive price to new highs/lows. NOTE: This rule is fairly stringent. Most people define a successful breakout as not retracing back into the prior price range. I’m looking for stronger breakout behavior.
Third, at least 30% of the cases meet both conditions. Anything less than that and your account equity will get chopped to pieces.
You can come up with your own rules to define a breakout. I wanted to keep mine simple so I could use it as a basic security filter, then let my breakout model do the rest.
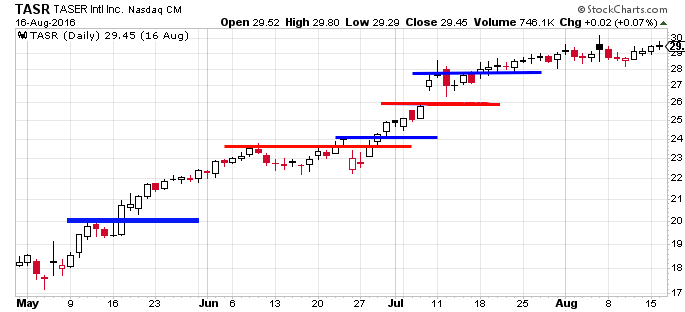
Using the TASR example above, let’s zero in on the May to August 2016 time period. Here you can see the first breakout (blue) successfully meets the criteria. The second breakout(red line) fails the criteria because price retraces back below the 1st bar’s close. The next breakout(blue line) succeeds, followed by another failure (red) and a final success (blue).
Breakout test examples
First, let’s take a look at four widely traded securities and analyze how “breakout friendly” they are using my criteria: S&P 500 index (SPX), USO Oil Fund (USO), CurrencyShares Euro Trust EUR-USD ETF (FXE) and Amazon stock (AMZN). I used a breakout look back period of 52 days and tested for the 3 criteria above using 10 years of daily price data from Jan 6, 2007 to Jan 6, 2017. Here are the results:
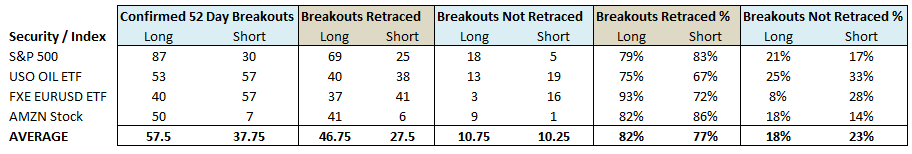
On average, there were 57 breakouts to the long side and 38 to the short side. A startling 82% of all long breakouts and 77% of all short breakouts failed by retracing back below/above the first breakout bar close. The EUR-USD ETF (FXE) had a 93% breakout failure rate. USO oil failed 75% of the time. Amazon failed 82% of the time. These are definitely not markets suitable for a simple breakout strategy.
These stats make sense from a fundamental standpoint. The S&P 500 and EUR-USD currency pair both have well-known mean reversion behavior, so pure breakouts are hard to come by and normally occur only when there is a significant market dislocation. Oil is a globally traded market with long term supply-demand structure. Amazon’s financials depend on billions of small transactions so it’s a very reliable cash flow stock with few surprises (as opposed to a fast-moving tech stock).
Next, let’s take a look at another set of securities to see if they would be good breakout trading candidates: Taser stock (TASR), Repligen stock (RGEN), iShares Silver Trust ETF (SLV) and continuous ICE Coffee Futures (KC).
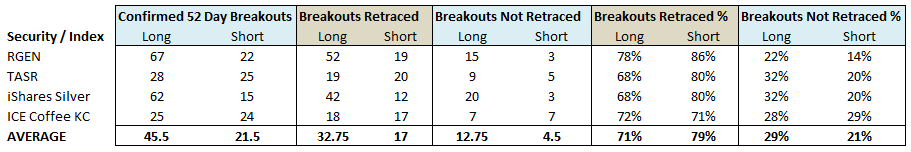
This second batch produced an average of 45 breakouts to the long side and 21 to the short side. 71% of all long breakouts and 79% of all short breakouts failed by retracing back below/above the first breakout bar close. 32% of long breakouts for TASR and iShares Silver (SLV) succeeded in meeting the criteria — just above the threshold of a “breakout friendly” security by my stringent criteria. Coffee (KC) also came close to meeting the “breakout friendly” criteria for both long and short breakouts.
Basic criteria for a “breakout friendly” security
By examining the breakout performance of these two groups, we can identify some basic criteria for a “breakout friendly” security.
First, it’s a niche-specific security with its own price-volume dynamics that are only loosely related to other market factors. The best examples are Repligen (RGEN) a biotech stock, and Taser (TASR) a defense technology stock. Each have their own economic drivers. Likewise, Coffee (KC) is an agricultural commodity with its own unique weather and supply-demand structure. In comparison, and index like the S&P 500 naturally has offsetting economic forces reflected in its price behavior, which makes it less likely to have event-driven breakouts.
Second, the volume of trading, float or open interest is low. Low float or low average trading volume for a stock, and low open interest for a commodity future, both mean that changes fundamentals are likely to drive price quickly to another level. Compare that to the S&P 500 or EUR-USD currency pair, the two widest-traded instruments in the world. It takes a substantial market shock to move their prices quickly to new levels.
Figuring out which stock, future, ETF, commodity or currency pair displays historical breakout behavior is 50% of the battle. You want to use your breakout trading system with the right type of securities from day 1, so the model has more opportunity to identify profitable trades. I hope this analysis provides some value for your breakout trading.
Learn More
To get started with breakout trading using Excel check out this Breakout Trading Model >


