
The foundation of a great trading system is the ability to identify and capture large price moves.
A system that consistently generates large winning trades can easily offset smaller losing trades and produce significant profits. This is the main feature of trend following systems.
How Trend Trading Systems Work — The Basics
In a nutshell, trend following systems generate profits by capturing large directional price moves with superior Win Size vs. Loss Size.
Trend following systems are very good at capturing the middle part of major price trends. However, they tend to enter and exit the trend late, giving back profits. Trend trading systems are also susceptible to losses in directionless markets (aka whipsaws).
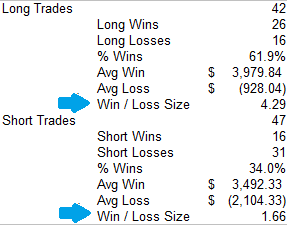
Moving Average Trading System Win-Loss Size
A typical successful trend trading system will produce only 40-50% winning trades. However, the size of those winning trades typically exceeds the average losing trade by 1.5x to 3x. This means the cumulative reward vs. cumulative risk for a trend following system can still be highly positive.
How to Design a Reliable Trend Trading System in Excel
Let’s assume our Excel trend trading model will use daily or weekly prices and volume data combined with technical indicators.
Moving Average Systems
Most trend following systems rely on technical price filters like moving averages or regression lines. Simple moving average and exponential moving average formulas are relatively easy to code in Excel.
The simplest system combines closing prices with a moving average. Buy when price crosses the moving average going up, sell when price crosses going down. Unfortunately these systems don’t work because they create an excessive number of false trade signals.
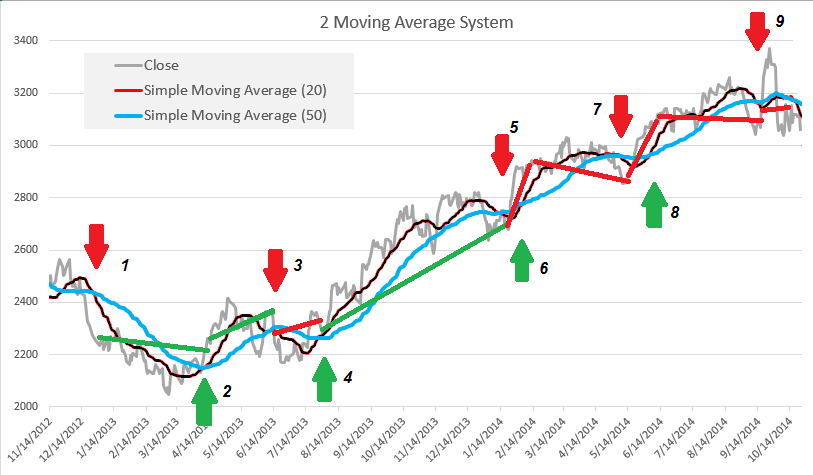
Double Moving Average Trend Trading System
A step up is a double or triple moving average system. Trades are taken when the moving averages cross up or down. These systems filter out more price noise and reduce false trades, but are still susceptible to whipsaws in directionless markets. They also tend to suffer when the moving averages get out of sync with price cycles. This can cause a consecutive series of losing trades and big equity draw downs. As you can see from the chart above, this 2 moving average Cocoa trading system generated only 3 out of 9 winning trades in a major uptrend and basically broke even. Not exactly stellar.
Trend Strength and Momentum Indicators
What we need is a second indicator which is uncorrelated with the moving average. This indicator will filter out directionless periods and reduce the number of unprofitable trades. Let’s try an experiment using four different “momentum” indicators:
- Average Directional Movement Index (ADX) which calculates the cumulative difference in True Range between price bars.
- Wilder’s Relative Strength Index (RSI) which compares the location of Open, High, Low and Close price points.
- Moving Average Convergence/Divergence (MACD) which compares the change in slope of moving averages.
- Chaikin Money Flow (CMF) which combines prices with volume to detect significant money flows in and out of a security.
How The Four Systems Stack Up
I created a back test using EURO vs. USD (URO) currency prices to compare these four indicators when used in a simple double moving average trend trading system. This was a “quick and dirty” test with no in sample / out of sample testing. CLICK TO VIEW LARGER IMAGE.
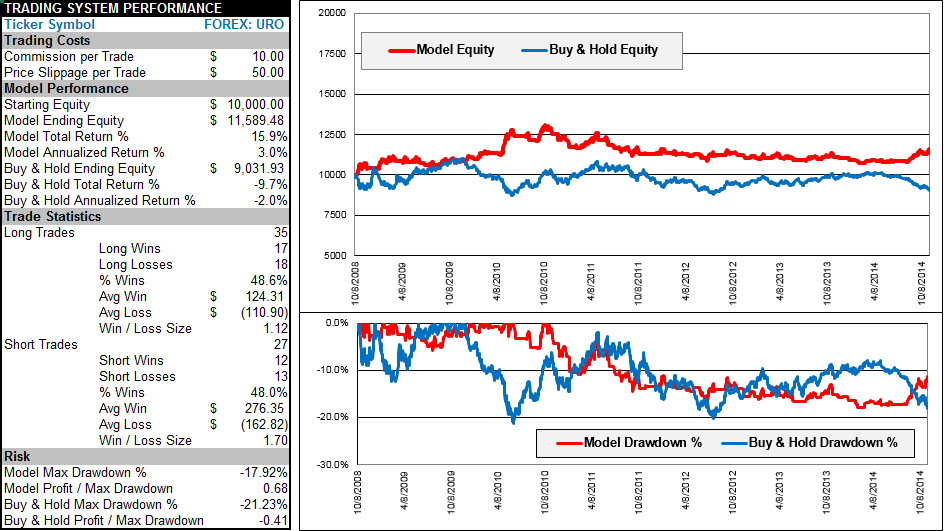
Baseline: Simple 2 Moving Averages System
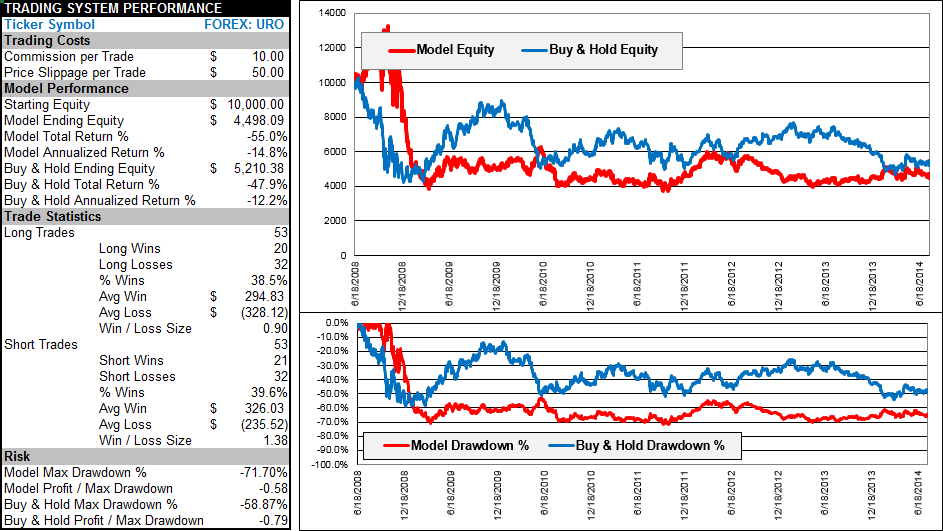
Excel Trend Trading Model Back Test Simple 2 Moving Average System
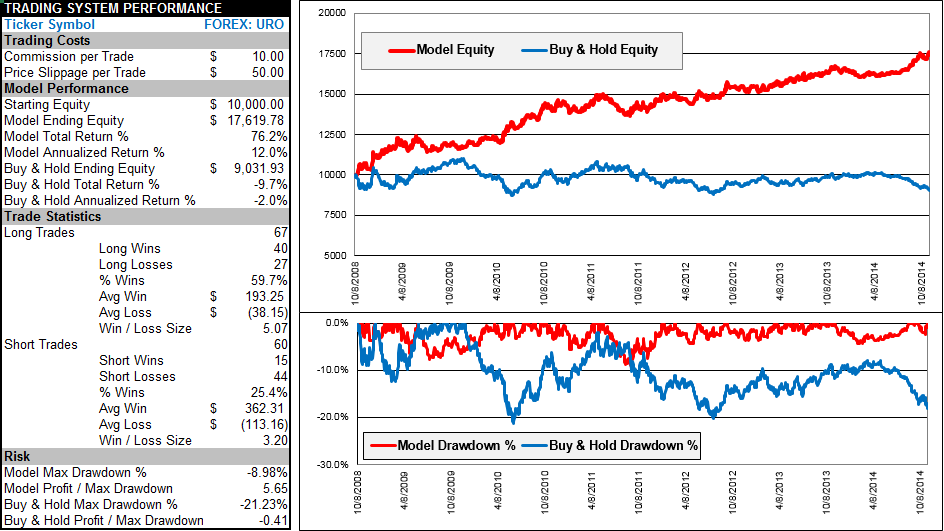
Moving Averages Plus ADX (you can buy this system here)
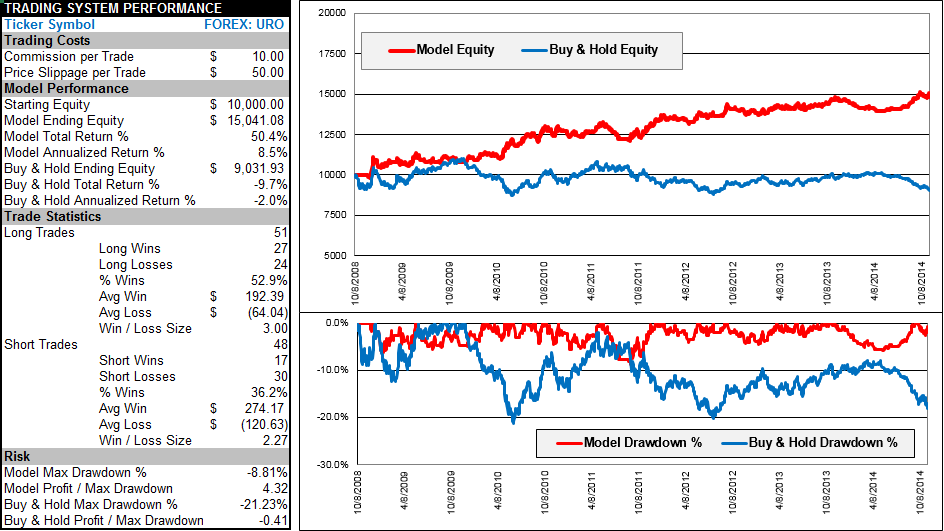
Excel Trend Trading Model Back Test 2 Moving Average System with ADX
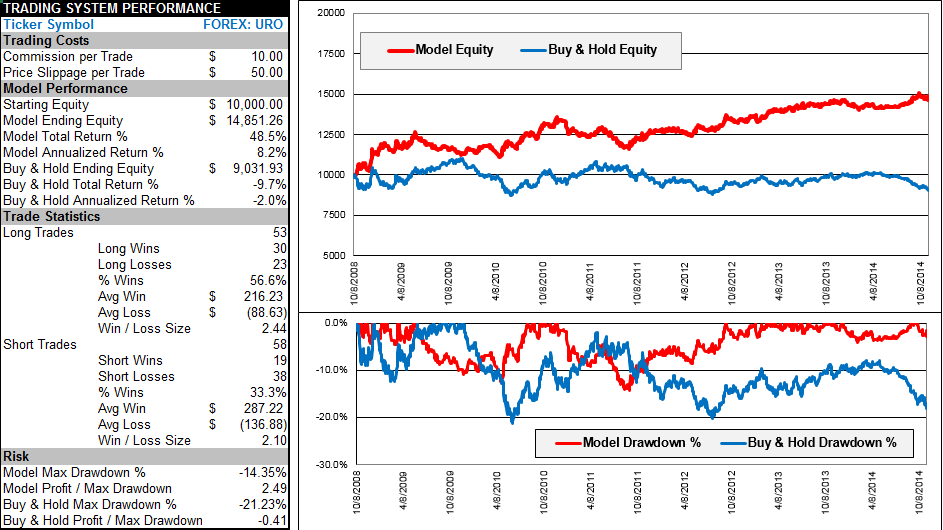
Moving Averages Plus RSI
Excel Trend Trading Model Back Test 2 Moving Average System with RSI
Moving Averages Plus MACD
Excel Trend Trading Model Back Test 2 Moving Average System with MACD
Moving Averages Plus CMF
Excel Trend Trading Model Back Test 2 Moving Average System with Chaikin Money Flow
This simple test demonstrates that adding a momentum or trend strength indicator can turn a losing moving average system into a potential winner. The ADX, RSI and MACD show promise but we won’t know which is the better system without extensive back testing across different securities, historical periods and time frames.
I hope this article provides some insight on the value of trend trading systems in Excel.
Happy trading!
*Indicator settings: Simple moving averages 5 and 20 days. RSI 14, with buys above 50 and sells below 50. MACD 12,26,9 with buys when MACD histogram is above 0 and sells below 0. ADX 14 with buys and sells above 10. Chaikin Money Flow 21 with buys above 50 day moving average and sells below the moving average.
**CFTC RULE 4.41 – HYPOTHETICAL OR SIMULATED PERFORMANCE RESULTS HAVE CERTAIN LIMITATIONS. UNLIKE AN ACTUAL PERFORMANCE RECORD, SIMULATED RESULTS DO NOT REPRESENT ACTUAL TRADING. ALSO, SINCE THE TRADES HAVE NOT BEEN EXECUTED, THE RESULTS MAY HAVE UNDER-OR-OVER COMPENSATED FOR THE IMPACT, IF ANY, OF CERTAIN MARKET FACTORS, SUCH AS LACK OF LIQUIDITY. SIMULATED TRADING PROGRAMS IN GENERAL ARE ALSO SUBJECT TO THE FACT THAT THEY ARE DESIGNED WITH THE BENEFIT OF HINDSIGHT. NO REPRESENTATION IS BEING MADE THAT ANY ACCOUNT WILL OR IS LIKELY TO ACHIEVE PROFIT OR LOSSES SIMILAR TO THOSE SHOWN.


