Once you’ve got your Excel trading model set up, populated with data and your order entry strategy worked out, it’s time to back test your trading model.
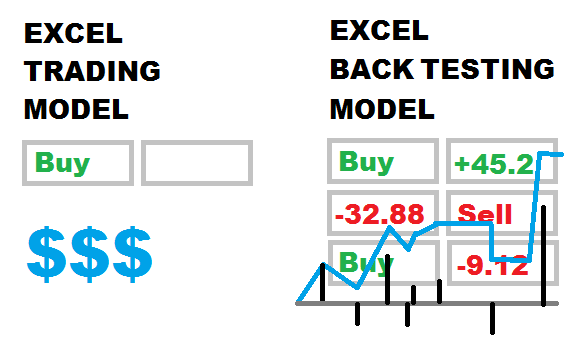
This step entails replicating your model logic in a brand-new Excel back testing model down to the smallest detail.
The back testing model is designed to process a large amount of historical data. The trading model formulas and logic are duplicated so they represent all the buy and sell orders that would have happened in the past. It includes complex per-trade and cumulative profit and loss formulas. The cumulative P&L and equity curve of your trading model can plotted over time.
The back test model may also include advanced performance figures such as:
- Maximum drawdown
- Win count and loss count
- Average win size and average loss size
- Standard deviations of returns
- Sharpe Ratio
- Expectation
- Sortino Ratio
- Returns vs. benchmark
- …and more
The real magic in a back testing model is in the complex formulas. You must not only perfectly replicate your trading model logic, but the profit, loss and cumulative equity formulas need to be 100% correct. If the formulas are wrong or they assume different order executions (e.g. next open vs. current close) then the back test results will not match your real trading model. When that happens it invalidates the entire back test. You can end up losing a lot of money through reliance on misleading back test results.
As mentioned previously, if your model uses trade orders other than market orders, back testing becomes much more complex. Just because price passes a limit order does not mean the order will be executed, nor that it will be executed at the expected price. This is also true for very large market orders that can affect the price of a security with limited market liquidity. This is one of the reasons high frequency scalping models often look profitable in back testing and lose money in real life.
NOTE: All the factors above make it very challenging to build a back testing model that works. If you don’t want to build your own, don’t worry. Just keep reading…
Proper back testing is done by segmenting your historical data into multiple parts, then testing independently against each part. At least one segment of the data should be left for “out of sample” testing. This prevents you from over-optimizing your model parameters to fit it to the data. A good model is the one that is stable across all data sets, not necessarily the most profitable one.
Now that you’ve committed to back testing your model properly, it is time to move on to Step 9 >