Excel Technical Indicators Library
26 Technical Analysis Indicators Pre-Built in Excel
Price: $97

Our Excel Technical Indicators Library contains 26 technical analysis indicators pre-built using formulas in Excel spreadsheet format.
These Excel files are tremendously useful for constructing trading, investing, technical analysis or statistical models in Excel. The pre-built technical indicator formulas save you countless hours of research and calculation time. The Excel Technical Indicators can be combined to build sophisticated trading models that perfectly suit your particular investment criteria.
All indicators are pre-built in Excel with formulas left unlocked to enable easy adjustment and modification. The indicators cover 300 periods of data, and can be expanded as desired. Each indicator is guaranteed to have 100% correct formulas.
All you need is Microsoft Excel and WinZip or a similar file extractor to unzip the files.
Key Benefits
- Eliminate the time and expense of constructing your own formulas.
- Easily combine indicators to build your own custom trading or analysis systems.
- Save money by eliminating recurring software costs.
- Learn how each indicator works (a key for debugging your models and institutional audits).
- Modify the formulas to suit your own analysis needs.
- Guaranteed 100% correct!
Excel Technical Indicators Included
Trend Indicators
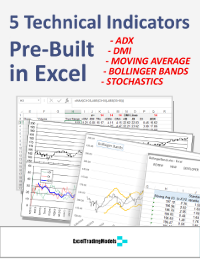
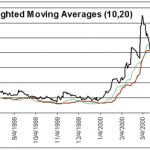
Exponential Moving Average
A responsive moving average that closely tracks price movements. The EZ-File allows you to easily adjust the moving average length by changing a single variable cell.
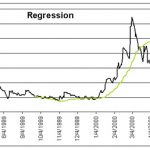
Regression
A linear approximation of price movements over time that is excellent for catching tops and bottoms.
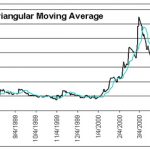
Triangular Moving Average (TMA)
A moving average in which the middle values are weighted more than the early and late values to enhance smoothing.
Sine-Weighted Moving Average (SWMA)
A moving average using a sine factor to take into account both time and price movements. Very good at catching tops and bottoms, while filtering out unnecessary noise.
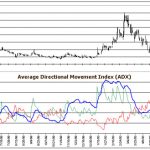
Average Directional Movement Index (ADX)
Measures the directionality of price movement over time to identify trending and non-trending periods.
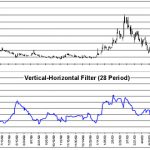
Vertical-Horizontal Filter (VHF)
Measures the directionality of price movement over time by capturing the relative location of price compared to its range in a set lookback period. Simpler and more sensitive than ADX.
Oscillators
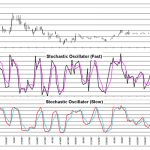
Stochastic Oscillator
A highly sensitive indicator used to catch tops and bottoms early.
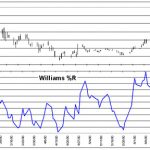
Williams %R
Measures the relative location of closing price in relation to the high-low range over a set time period.
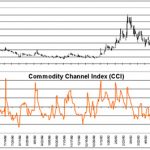
Commodity Channel Index (CCI)
An indicator which measures price excursions from an average of the 11 previous price periods. Good for catching tops and bottoms.
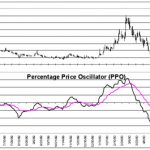
Percentage Price Oscillator (PPO)
Similar to the MACD indicator, but normalized on a percentage basis for easy comparison across different securities.
Volatility Indicators
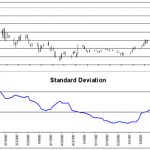
Standard Deviation
The fundamental indicator used to measure volatility over time.
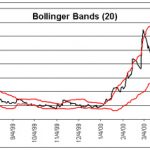
Bollinger Bands
Used to visually judge the relationship between price and volatility changes.
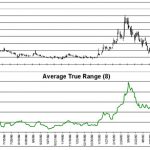
Average True Range (ATR)
Dynamically measures the typical range between price high/low/close over a set period.
Momentum & Strength Indicators
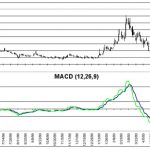
Moving Average Convergence-Divergence (MACD)
An indicator that shows changes in the relative movements of shorter and longer moving averages. Good for identifying changes in momentum.
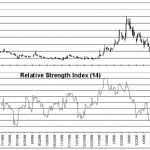
Relative Strength Index (RSI)
Measures price relative to past prices. This indicator is front-weighted for sensitivity, but filters out noise well.
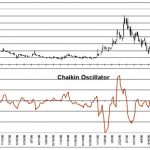
Chaikin Oscillator
This indicator combines both price and volume to measure momentum from a security’s accumulation and distribution in the market.
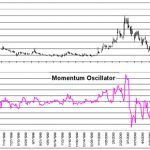
Momentum Oscillator
A simple indicator which compares later prices to earlier prices to gauge strength and momentum.
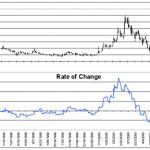
Rate of Change (ROC)
A simple indicator which compares later prices to earlier prices to gauge the speed and direction of price movements.
Volume Indicators
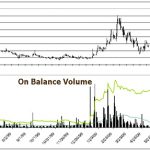
On Balance Volume (OBV)
This indicator adds and subtracts volume to a running total, depending on whether price moves up or down. A good confirming indicator.
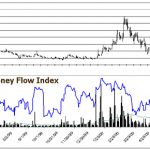
Money Flow Index (MFI)
Similar to OBV, but enhanced by the addition of momentum characteristics based on relative location of price. Can be used as both a primary and confirming indicator.
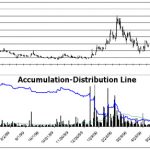
Accumulation/Distribution Line (AD)
Measures the amount of buying and selling pressure by weighting it with the relative location of price.
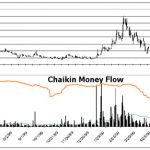
Chaikin Money Flow (CMF)
This indicator enhances the usefulness of the AD by dividing a running total by a running total of volume.
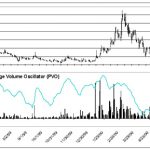
Percentage Volume Oscillator (PVO)
This indicator is excellent for judging changing levels of interest and momentum in a security’s movement.
Intermarket & Breadth Indicators
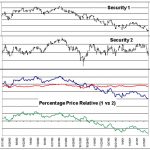
Percentage Price Relative (PPR)
This indicator compares the relative price movements of two different securities or indices to help allocate capital better and give insight into future price moves.
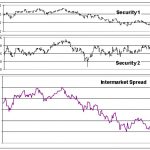
Intermarket Spread
Measures the gap between the prices of two different securities or indices to identify arbitrage or directional investment opportunities.
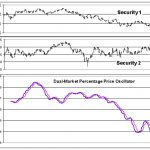
Dual-Market Percentage Price Oscillator (DM-PPO)
A Percentage Price Oscillator applied to the moving averages of two different securities or indices to identify tops and bottoms in directional momentum and strength.