Build a Fund Investing System in Excel Course
This course teaches you how to build an investing system in Excel that selects the most profitable funds to maximize returns in your 401(k) or IRA

What You Get

How To Course
Step-by-step course covers strategy, data, formulas, VBA and FAQs

Price Data Import
Detailed instructions on importing fund price data into Excel

Back Test Model
Includes a complete back testing model with detailed stats

Your Watch List
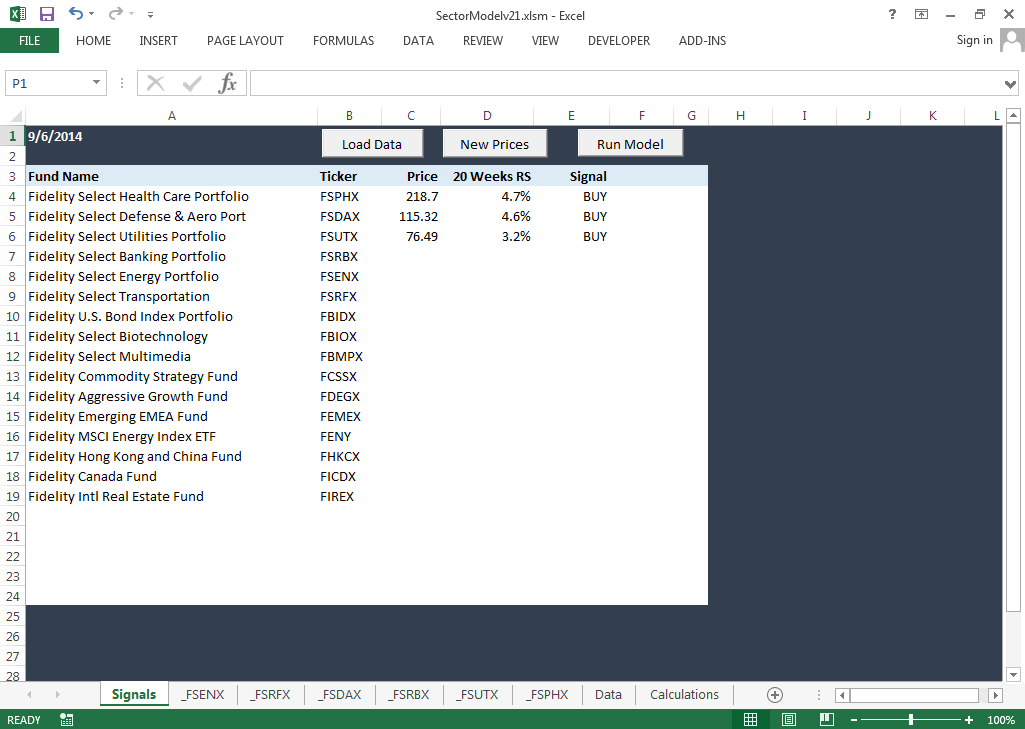
Build and maintain a watch list of profitable funds or ETFs
Detailed Overview
This course walks you step-by-step through building an automated long term fund investing model using Excel.
The system is designed to maximize your 401(k) or IRA returns by investing in sector funds using a proven economic rotation strategy.
The model is based on the classic market economist’s Sector Rotation Model which identifies the most likely sectors to profit during any given economic market cycle phase. Crucial improvements have been added that eliminate the guesswork in timing sector fund changes. Over long periods the strategy can significantly outperform diversified buy and hold investing by focusing capital on economic sectors most likely to outperform the overall market.
The system identifies the funds or ETFs most likely to generate profits using three proven indicators: relative strength, moving average crossovers and moving average slope. The system allocates capital to market sectors most likely to generate superior returns, with confirmation from actual price movements. It can be used with any mutual fund, sector fund, index fund, ETF or ETN.
The course teaches you how to import free weekly price data from the Internet. It also shows you how to import prices into Excel using a DDE link from your broker or data provider if you have one available.
Excel’s VBA language is used in conjunction with spreadsheets, links and formulas to deliver a powerful and flexible investing tool.
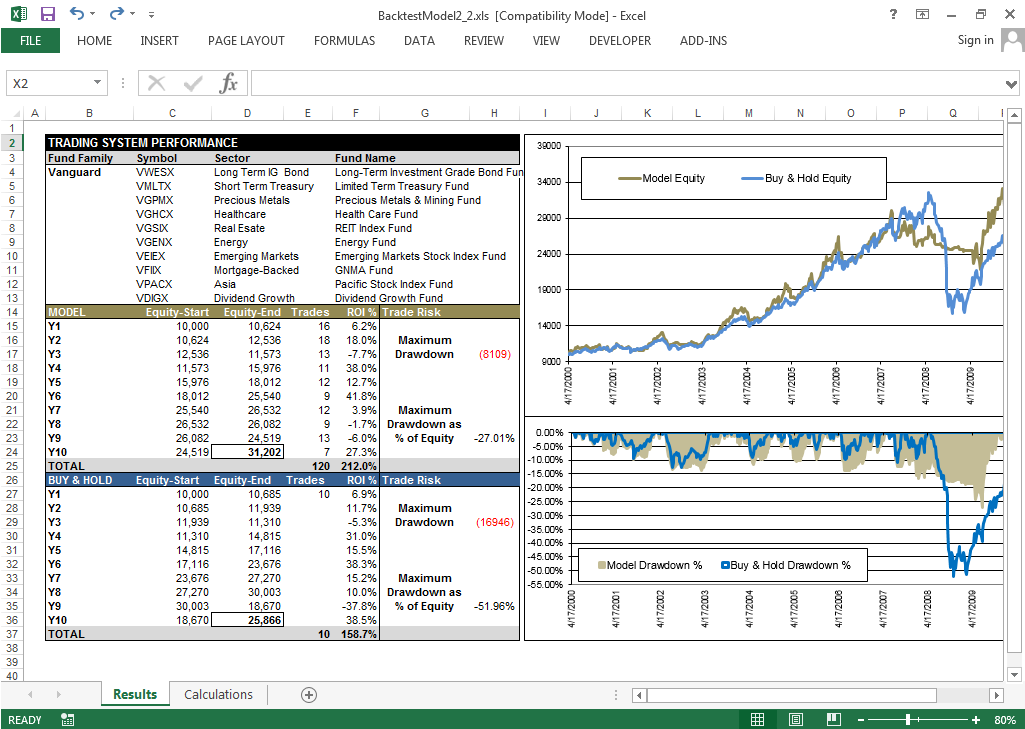
A pre-built back testing model is included that lets you test up to 10 different funds or ETFs versus buy and hold over 10 years of price history. The back testing model calculates and displays detailed performance and risk statistics to help you construct a profitable portfolio.
Screenshots
Watch List & Signals Sheet
Back Testing Model
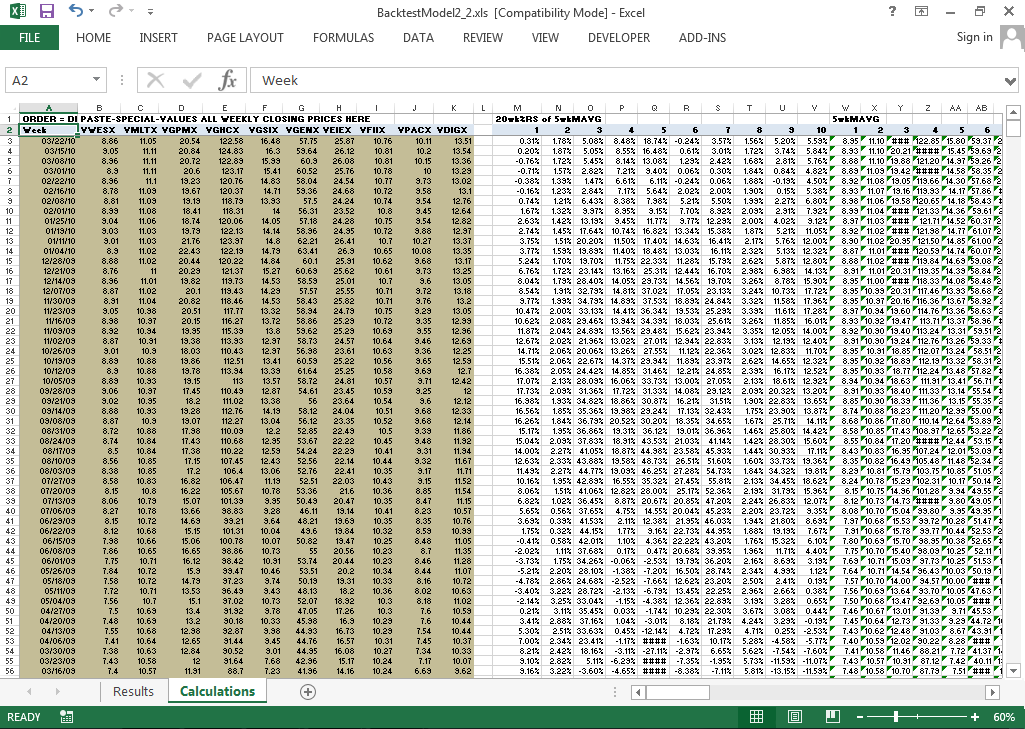
Calculations Sheet
Strategy Guide
Benefits
Calculate buy/sell signals on a large number of funds or ETFs in seconds |
|
Integrate Excel, VBA, formulas and data sources into a profitable investing system |
|
Apply the knowledge you learn to any Excel modeling or research project |
|
Save significant money by eliminating recurring software and data costs |
|
Get instant access to the materials in a zip file emailed directly to you |

