If you are a trend trader your best profits will come by trading markets and securities that have a tendency to move in strong price trends.
A key goal then is determining the “expected trend strength” or “trendiness” of a security. You must usually wait until a price trend is well underway to see how strong it is. But what if you could identify BEFOREHAND if a particular security will have strong price trends?
Wouldn’t it be useful to pre-filter a bunch of securities for their “trend strength” ranking to use in your Trend Trading Model?
I’m going to show you a simple technique using Excel to identify securities that have a tendency to move in strong price trends.
My goal here is simply to demonstrate a useful security selection filter. Excel is very handy for this type of analysis.
My “Trend Strength” Ranking Indicator
To determine the “expected trend strength” or natural “trendiness” for our 3 securities, we will use the Average Directional Movement Index (ADX).
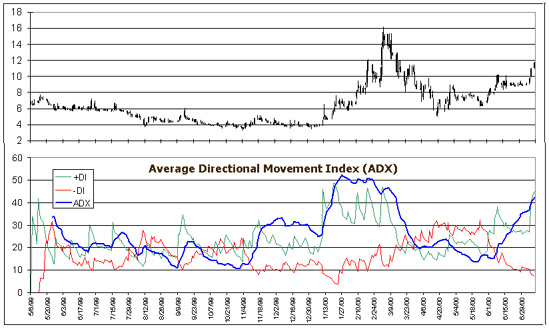
The ADX is designed to signal trend strength over a set time period by comparing the relative open and close price locations in each price bar, then averaging these positions in a particular way. For this test I used the Excel ADX indicator freely available in our 5 Free Technical Indicators in Excel package.
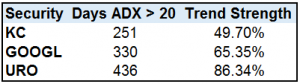
My calculation for “trend strength” is simple: Trend strength = the cumulative number of days ADX is above 20, divided by the total days tested. ADX was set at 14 periods for this test.
The Three Test Securities
I used daily prices for Google (GOOGL) from January 2013 to January 2015, EURO/USD (URO) from May 2014 to May 2015 and Kansas City Corn (KC) from December 2011 to December 2013. As you can see from these charts, each security had major price trends in the selected test periods.
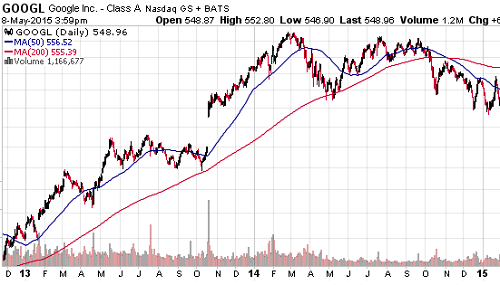
Google 2011-2013
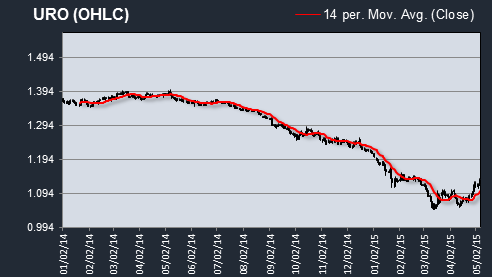
EUR-USD 2014 to 2015
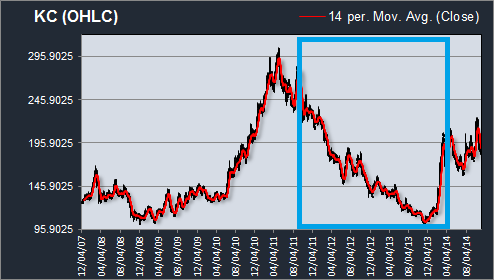
Kansas City Corn 2011-2013
Trend Strength Test Results
Our three test securities produced significant price trends during three different time periods. As shown below, our test results suggest that EURO-USD (URO) currency may be expected to exhibit the highest trend strength once ADX rises over 20.
This suggests that once a price trend begins in EURO-USD there may be a higher tendency to continue trending than either Google stock or Kansas City Corn. This means EURO-USD is a good candidate for a Trend Trading Model.
Key Assumptions
Ideally, our trend strength test would use different securities that trended at the exact same time, but that doesn’t really exist. So I assumed these trends are “typical” ones for each security, and evaluated trend vs. trend regardless of the dates they occurred.
Trend Strength Test Results
This test operates on the assumption that there is SOME relationship between a security, its liquidity, economic cycles and market behavior that will repeat in the future. Whether similar trending price behavior will actually occur in the future as it occurred in the past is beyond our ability to know.
Keep in mind that we’re just trying to narrow down the population of securities to trade with a particular model. It is still up to the model logic to generate accurate buy-sell signals.


