
When trading price breakouts, the second worst thing that can happen is getting caught in a bull or bear trap. Instead of following through with the initial move, price quickly reverses and reenters the price range from which it just escaped. If you’re smart you have a stop in place and you exit at a loss.
When breakouts become BLOWOUTS
What’s the single WORST thing that can happen when trading breakouts? A massive price gap against you after an apparently strong breakout with multiple points of confirmation.
ZNGA breakout failure #1
Let’s take a look at two such scenarios, both in Zynga (ZNGA) stock. (Charts courtesy of StockCharts.com)
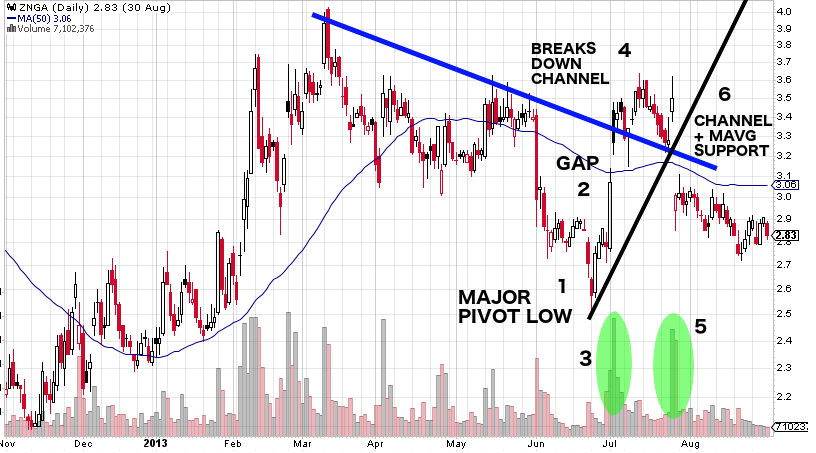
In the first half of 2013 ZNGA made a significant bull move up to $4 off of a major bottom at $2.10. The stock then sold off in a volatile fashion from the high in March to a major pivot low in late June. It then reversed on high volume and gapped up at the beginning of July to test the prior pivot high resistance level at $3.30 to $3.60. After breaking the downtrend line just above the 50 period moving average it retested it several times and never filled the gap. This is where it gets interesting…
 When price reached the confluence of the mid-term downtrend line (now support) and the new steep uptrend channel, price suddenly gapped up on 2 days of high volume. At this point there were 6 supporting factors strongly suggesting this was the beginning of a major potential breakout to the upside: A major pivot low (1), a gap up (2) on high volume (3), breaking the downtrend line with several support tests and a retest of the prior pivot high (4), and two up bars on high volume (5) bouncing off of the downtrend channel plus 50 period moving average support at the confluence of a steep new uptrend line (6).
Everything suggested a big move up. A breakout to the upside was inevitable, right?
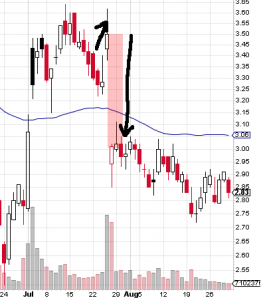
Wrong! As you can see, price crashed overnight from the close on July 27 at $3.50 to the following day’s open at $3.02, a 13.7% price drop overnight. Far from a breakout to the upside, this price failure was a BLOWOUT with zero opportunity to escape.
ZNGA wasn’t quite done with the breakout traders, though.
ZNGA breakout failure #2
The much-anticipated upward surge finally materialized, with price rising quickly from just below $3.00 in September to $4.50 in December 2013. On December 28 ZNGA made its 3rd touch of strong lower channel uptrend support and pivoted up into January (1).
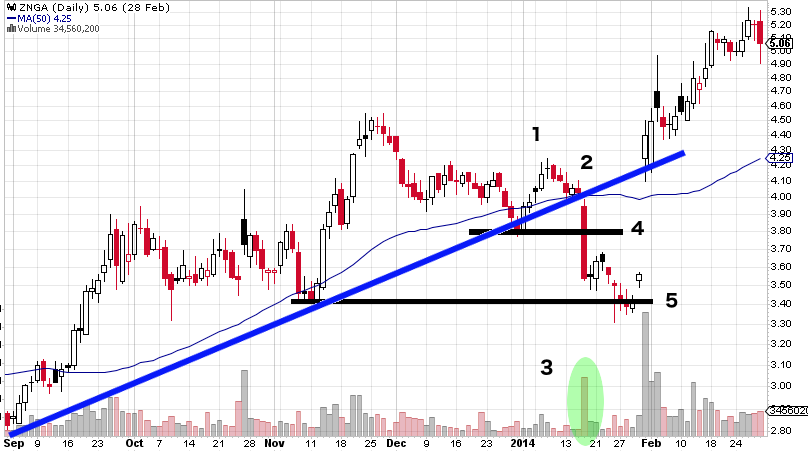
Here is where it gets interesting again. In mid-January the uptrend petered out and ZNGA quickly dropped through both uptrend channel support and the 50 day moving average (2). The move came quickly on high volume (3), breaking 1st prior support (4) and suggesting a major potential selloff ahead. Over the next week ZNGA continued to drift down as expected and actually broke below 2nd prior pivot support at $3.40 (5).
Traders who positioned themselves to the short side at both breakout points (4) and (5) suddenly found themselves on the wrong side of the market on January 31 when price skyrocketed with a massive gap on high volume from $3.56 to $4.25, a 16% overnight loss.
Breakout to BLOWOUT again!
How do BLOWOUTS impact your breakout trading strategy P&L?
The obvious answer is BLOWOUTS HURT your P&L…right?
Not so fast. If you’re going to trade a breakout strategy (or any strategy for that matter), you will face these situations and it may negatively impact your equity curve. The question is whether the impact is significant enough to merit not trading breakouts or allocating less money to a breakout strategy.
One way to objectively assess the impact of blowouts is to backtest stocks where they have occurred in the past, such as ZNGA. If the impact is substantial enough, then risk vs. return becomes a concern and de-selecting the stock from the model’s watch list might be the answer. If the negative impact is offset by substantially greater positive returns, however, then the breakout strategy can still be traded with adequate diversification and money management.
Backtesting BLOWOUTS
Let’s take a look at a backtest of ZNGA using my standard long-only breakout trading model and daily price bars. The backtest P&L logic assumes a signal is produced at the end of day 1 and the trade is executed at the start of day 2. The backtest model realistically handles exposure to overnight gaps, so it is capable of accurately testing the two ZNGA BLOWOUT situations above.
Here is ZNGA’s long-only breakout model backtest results. It shows the breakout model equity curve vs. buy & hold, comparative drawdown chart and trade P&L / risk statistics for the period December 16, 2011 to January 17, 2017.
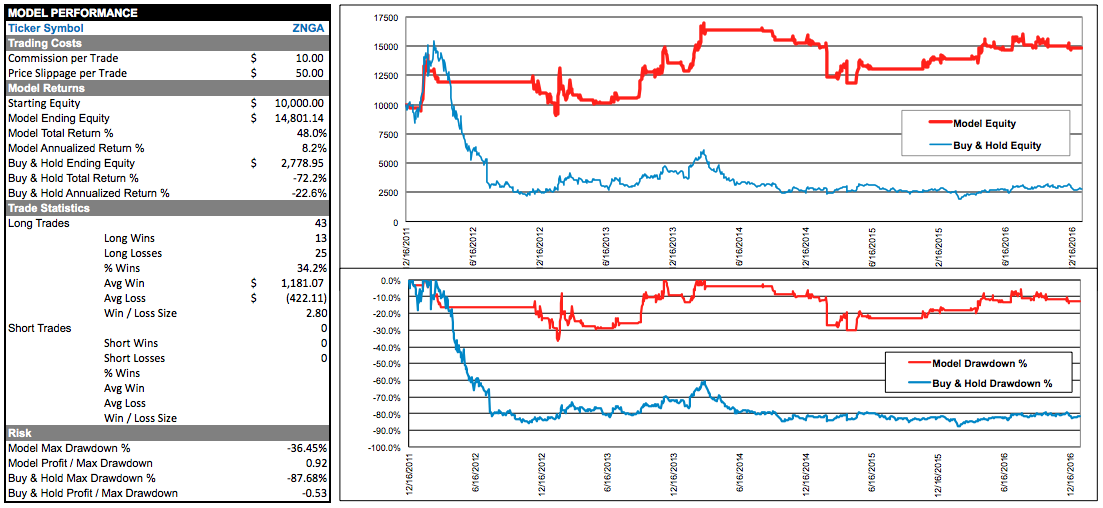
The first obvious thing is that ZNGA had horrible buy & hold performance over the test period. Forget the surprise price gaps — this stock was a dog, losing over 80% of the $10,000 starting equity. The long-only breakout model generated a total return of 48%, despite the fact that ZNGA was in a downtrend 60% of the time.
So what happened during the two BLOWOUT situations discussed above? The BLOWOUT n late July 2013 had no effect on the model P&L because a long trade was never made — the model’s parameters were not met for a legitimate breakout trade (2 clean bars above the highest high of the last 10 bars). The BLOWOUT move to the upside on January 31, 2014 was actually captured by the model as a profitable trade.
A price series may be full of gaps that can easily trap a visual breakout trader, but that does not mean a mechanical trading model will suffer the same fate. The bull trap / bear trap conditions occurred in both instances — the breakout model simply did a better job of handling them. This goes to show that trading visually and trading with Excel using mechanical rules often lead to different outcomes.
In both BLOWOUT cases above, a visual “breakout” occurred with only one bar breaking through prior resistance or support. This led to two major trading losses. The Excel breakout model requires a two-bar breakout pattern before entering a trade. With volatile securities like ZNGA, requiring a two-bar breakout can substantially increase P&L performance and smooth the equity curve by filtering out risky trades.
The Excel model’s requirement for a confirmation eliminated the common trader’s mistake of jumping on a “breakout” too soon before the market has had a chance to determine the true price direction. A single close above or below a major prior high or low is not sufficient evidence of a breakout. Trading with insufficient evidence can be risky as shown in the two cases above.
Learn More
To get started with breakout trading using Excel check out this Breakout Trading Model >


