A few years ago I made a $1,000 trade in Advance Emissions Solutions (a clean coal company NASDAQ: ADES) for around $5 per share. After two years and 3 long trades, ADES topped out at over $28 per share. The net profit on my long trades was over $16,000 on that initial $1,000 position, with an additional $5,000 added at the second trade. I was trading on daily bars, executing long trades at the open (-ish) based on signals taken from my Excel Trend Trading Model.
(FYI – I subsequently shorted ADES for a total profit of about $22,000. My equity draw-down never exceeded 8%.)
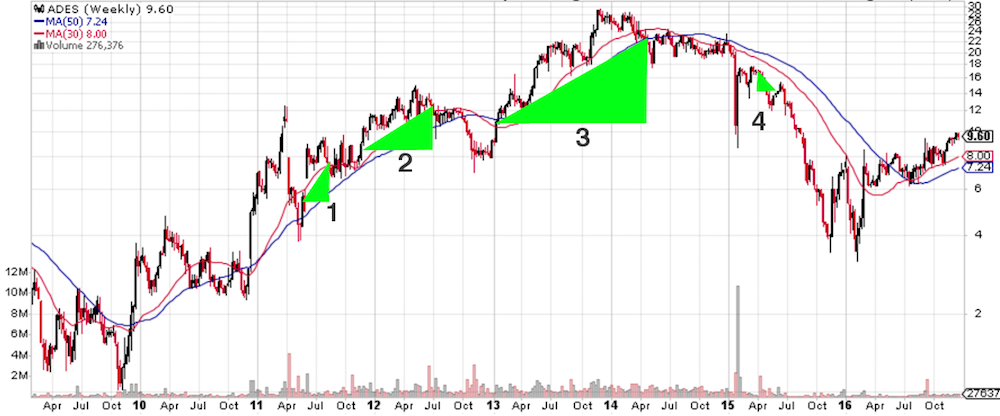
Above is a chart courtesy of StockCharts.com with the trades marked.
Below is a quick case study of the four trades.
Trade #1: I took a small position of $1,000 to minimize risk. Bought 177 shares @ $5.62. Exited the long trade @ $7.82 for a profit of $391.
Trade #2: I added $5,000 to my trade equity on the second trade. I bought 765 shares @ $8.35 and exited the trade @ $12.38 for a profit of $3,084.
Trade #3: I bought 895 shares @ $10.58 and sold @ $22.18 for a profit of $10,389.
Trade #4: I shorted 1,130 shares @ $17.55 and covered @ $14.08 for a profit of $3,926.
Ending equity = $23,792 LESS $6,000 invested = $17,792 profit.
This is a good case study on how to use an Excel trading model to capture long term trends. Trading trends is a waiting game. Compounding returns by rolling profits into new trades and increasing equity size after successful trades can boost your account size in a big way. Patience and obeying my model’s trading rules during this 2-year period really paid off.
One thing I will note here: I had never heard of ADES weeks before I made that first trade. I added it to my trading model watch list because it was a clean tech stock, had a low stock price and low float. I would never have discovered these trades without my trading model telling me to buy it.
* These trades were identified by ExcelTradingModel’s Trend Trading Model in Excel.


