As an example, we will show how a simple yet effective correlation trading model can be built in Excel with free data and some basic statistical formulas. The idea here is to compare two closely related stocks of similar size and volatility in the same industry, calculate a “typical” price movement correlation level between the two stocks, and look for situations where the expected relationship diverges significantly.
The two stocks we’ve chosen are Lowes (LOW) and Home Depot (HD), two big-box U.S. home improvement retailers. These two companies are widely diversified across the U.S. and are subject to similar economic forces. As a result, we would expect their stocks to behave similarly under “normal” circumstances (i.e. where there are no mergers or bankruptcies involved).
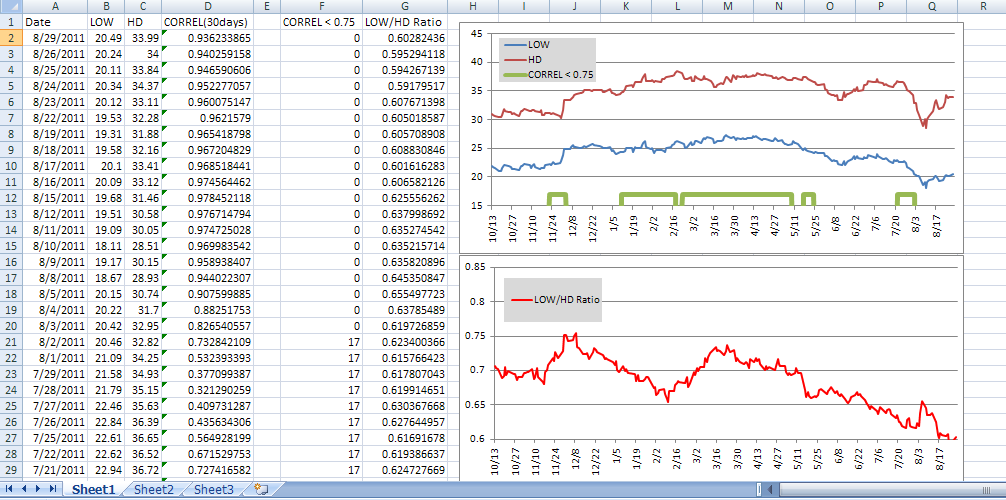
Excel Correlation Trading Model
Our first step is to collect a year’s worth of historical data for each stock, in this case August 21, 2010 to August 21, 2011. The amount of data you use depends on whether you are using intraday, daily, or weekly data, but usually 1-2 years is sufficient. We got our daily closing price data from Yahoo! Finance and imported it into excel. For hints on how to do this, see How to Import Market Data Into Excel.
Starting with 2 arrays of closing price data for LOW and HD, we use the native Excel =CORREL() function to calculate a rolling 30-day correlation over the last year in the next column. This will be used to detect when the two stocks are becoming more or less correlated in their closing price movements. However, this will not tell us what direction to take when we make a trade. For that, we need a directional price indicator.
To indicate what position (long or short) to take in each stock, we calculate a simple ratio by dividing LOW by HD, or =LOW/HD. This simple calculation tells us the percentage the LOW closing price is of the HD closing price. When this ratio is going up, we should take a long position in LOW and a short position in HD. If this ratio is going down, we take a short position in LOW and long position in HD.
However, we only want to take a position when the correlation between LOW and HD is breaking down — in other words, when it drops below some “normal” level. Using the =CORREL() function over the entire 1 year data history, we discover the “normal” correlation is about 0.825. We also notice that there are a few periods when correlation drops below 0.75, and these periods coincide with big movements in one stock or the other. Therefore, we decide to use 0.75 as the “trigger” when trades are allowed.
Our trading rules are therefore:
RULE 1: If correlation < 0.75 and LOW/HD ratio is rising buy LOW and short HD.
RULE 2: If correlation < 0.75 and LOW/HD ratio is falling short LOW and buy HD.
ELSE: No position.
In the upper chart the green periods indicate when correlation < 0.75. In the lower chart, we can see that these periods coincide with big changes in the LD/HD price ratio. Examples include 11/24-12/5/10, 1/15-5/11/11, 5/15-5/25/11, and 7/20-8/3/11.
This is just one simple example of using correlation and regression statistics to build a useful trading model in Excel.


